Wall Street Journal Stock Data Concept Helps Viewers Visualize Stock in 3D
Both augmented reality and virtual reality technologies lend themselves easily to 3D data visualization applications. The Wall Street Journal is tapping into this for the US stock market data visualization.
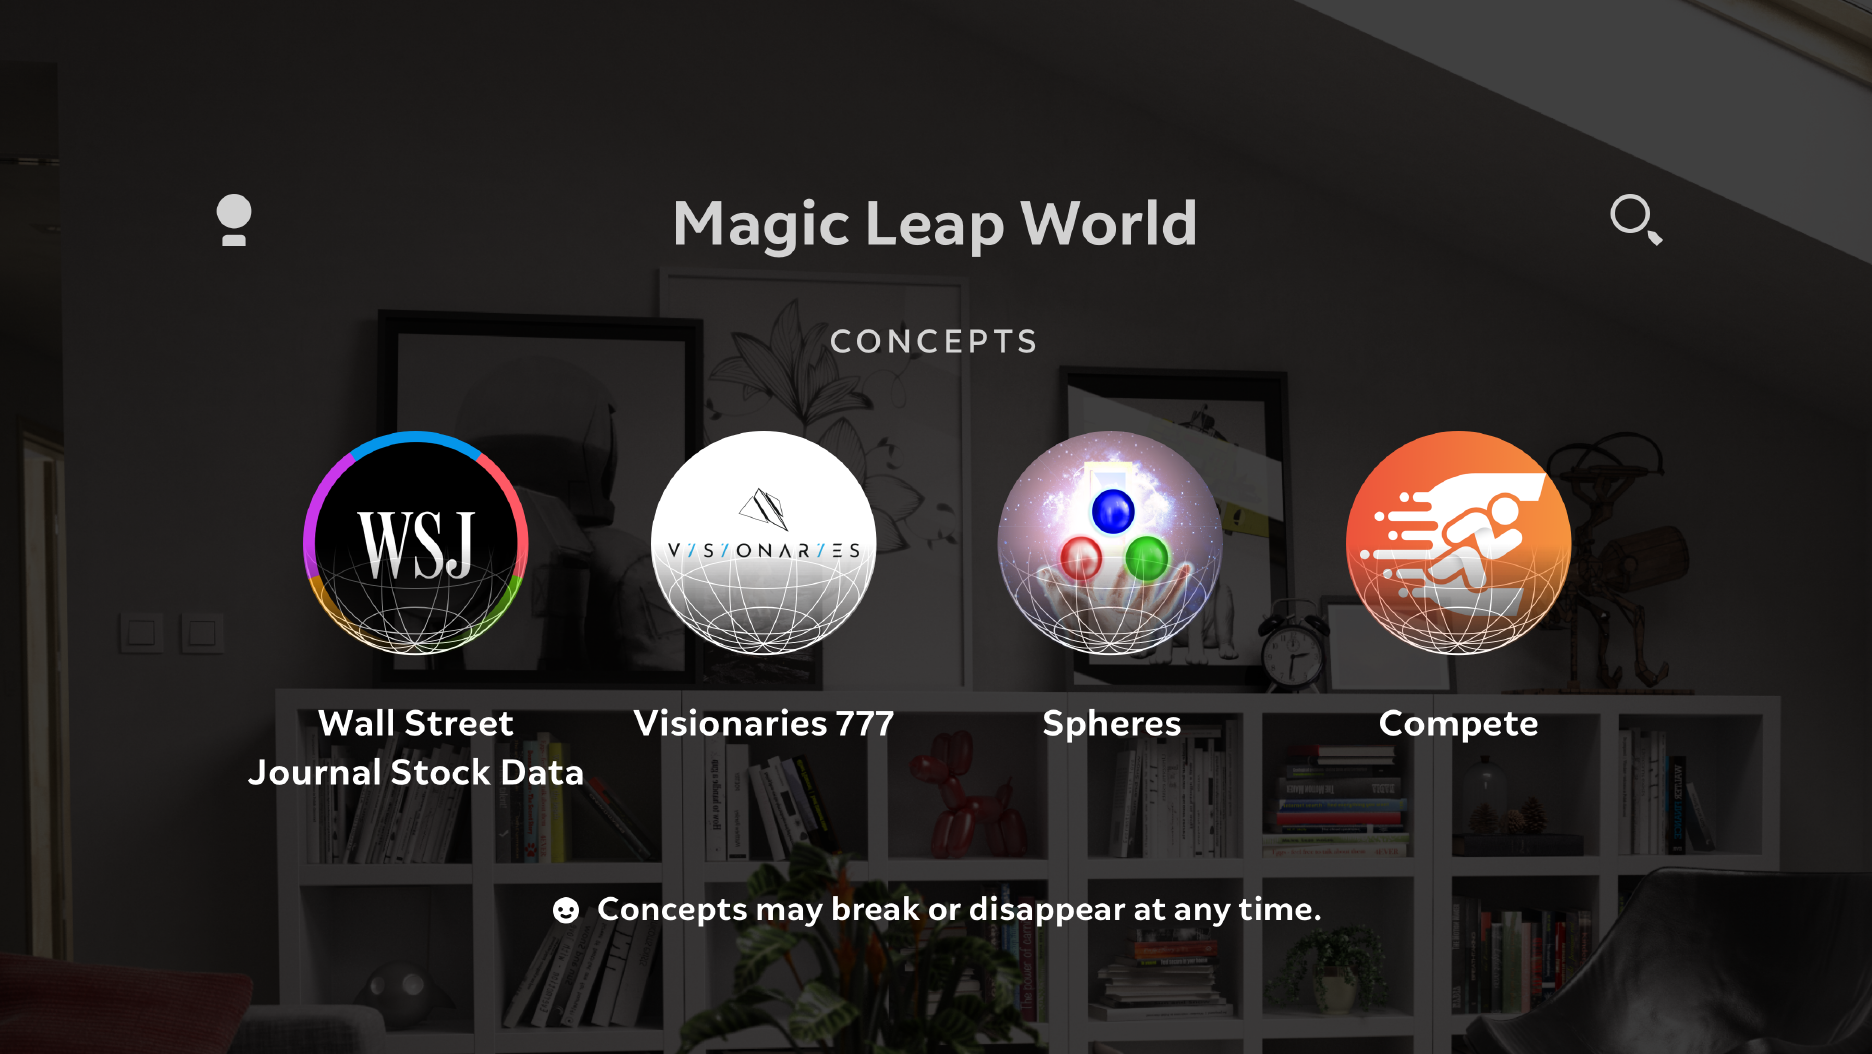
WSJ has created a Magic Leap One concept app which shows how to visualize the stock market as an AR representation in 3D. Known as the Wall Street Journal Stock Data Concept, the app came to light following Magic Leap’s decision to allow third-party developers to publish Concepts, free apps with limited functionality that enable developers to collect feedback and also share their work with the Magic Leap community. The Wall Street Journal Stocks Data Concept has been one of the first concepts published on the platform.

The Dow Jones Innovation Lab has been quite aggressive in exploring the frontiers innovation. It created the concepts to explore how spatial computing and Magic Leap could help usher in new possibilities for data visualization.
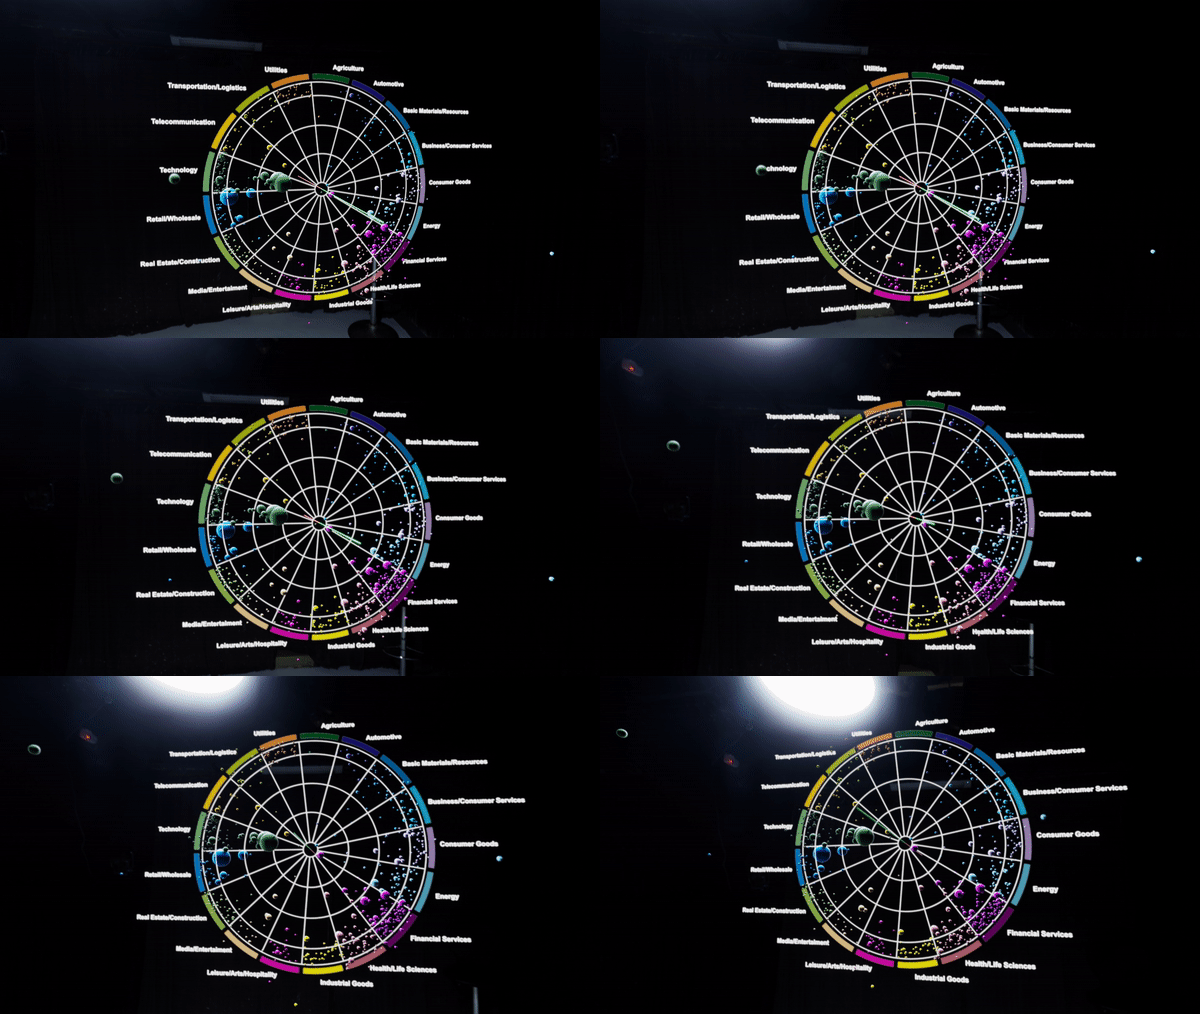
The WSJ concept provides a way to visualize and animate the WSJ market data covering every US stock that is above $1 billion market capitalization on a radical scatter plot. Early prototypes of this were showcased by Dow Jones at Davos, at The Wall Street Journal Future of Everything Festival as well as in various other conferences. With the Magic Leap concepts, it is now available internationally and also exclusively on the Magic Leap World.

The WSJ 3D data visualization project taps into the massive potential for data visualization. The ability to take complex data sets and add the spatial dimension to better understand them is one that many data consumers are increasingly getting to appreciate. Some of the key uses-cases for XR will come from this kind of data visualization in the future. Currently, experts are increasingly deploying machine learning to help in breaking down the high dimensionality datasets for the average data consumers. With the creation of spatial representations of data through 3D, it is possible to radically simplify data sets and empower data consumers to better understand the data that is being presented to them.
The WSJ concept provides up to five different dimensions of data which have been packaged into a single graph. It makes stuff relatively easy to understand even if there is a vast amount of data to be presented. With 3D data visualization, even the novice user will be able to comprehend hitherto complex datasets. According to the Innovation Tech Lead at the Dow Jones Innovation Lab Roger Kenny, human beings are extremely good at understanding concepts spatially. We understand stuff better when they are put in multi-dimensional terms as the mind is capable of naturally absorbing information better in this format than in the traditional 2D data visualization. According to Kenny, spatial data processing activates the “original part” of our brains because human beings have evolved to navigate the physical world which makes our brains capable of understanding space at a very basic level. The 2D data visualization, on the other hand, is more abstract and complex for the brain. The brain responds much better to objects which are “floating in space”.

The WSJ concept presents the first time that users are able to view the entire market at once. Viewers will be able to see a sped-up time-lapse of the all the day’s movements. There are other more familiar charts that are used in market visualization but they simply cannot support the level of data throughput that is available in the Wall Street Journal Stock Data Concept. With the concept, it is possible to have a complete trading novice look at the data visualization and pick out some of the best stocks. An expert user may not necessarily benefit from this but it totally revolutionizes the way in which we look at and understand data overall. It could also have some long term implications for expert users who are more adept with abstract datasets.

For lay people, however, it is clearly a godsend. They are able to smoothly process data sets that were previously too complicated and out of reach thanks to the spatial context with which it is now presented.
The technology also has some educational implications. It makes it a lot easier to absorb information or data sets where the pieces somehow relate to the whole. Where you can spot an anomaly and show someone why it deviates from the norm versus just looking at the dataset on paper and explaining the different complex concepts. Spatial computing enables users or consumers of data to communicate to a primeval part of the brain that has been shaped through millions of years of evolution. Over millennia, human beings have evolved to navigate the physical world so at the native level, the human brain is highly attuned to understand space. The brain reacts more naturally to objects which are floating in space.
https://virtualrealitytimes.com/2019/09/23/wall-street-journal-stock-data-concept-helps-viewers-visualize-stock-in-3d/https://virtualrealitytimes.com/wp-content/uploads/2019/09/Wall-Street-Journal-XR-600x338.jpghttps://virtualrealitytimes.com/wp-content/uploads/2019/09/Wall-Street-Journal-XR-150x90.jpgAugmented RealityTechnologyBoth augmented reality and virtual reality technologies lend themselves easily to 3D data visualization applications. The Wall Street Journal is tapping into this for the US stock market data visualization. WSJ has created a Magic Leap One concept app which shows how to visualize the stock market as an AR...Sam OchanjiSam Ochanji[email protected]EditorVirtual Reality Times - Metaverse & VR
